| Panel | ||||||||
|---|---|---|---|---|---|---|---|---|
| ||||||||
Site admins have access to site graphs that represent the users and files in their site.By default, graphs display site activity from the last seven days. This timescale can be changed (see below). Looking for data on user activity? See View user activity in audit logs. |
Step-by-step:
1. Click Admin at the top of your desk Chorus and sign in to elevate.
2. Choose Reports > Graphs from the Admin menu. The Graphs modal will open.
3. Click on one of five tabs that are available on the Graphs modal:
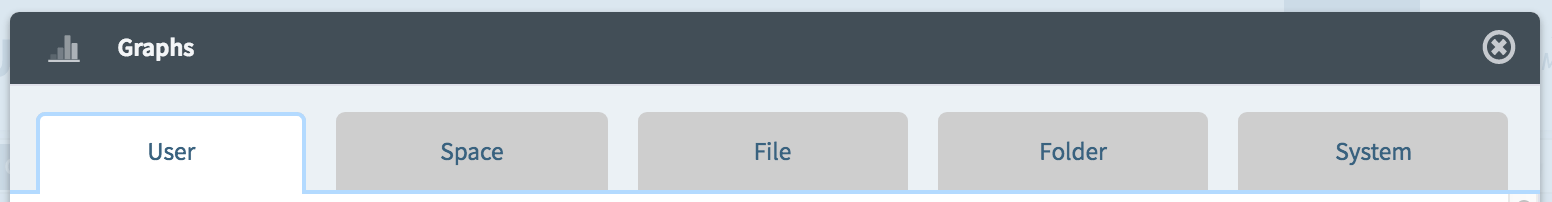
| User | See the number of user accounts in the site, as well as the number of successful vs failed sign in attempts. |
|---|---|
| Space | See the number of spaces in the site. |
| File | See the number of files in the site. |
| Folder | See the number of folders in the site. |
| System | See the in/out levels of network traffic, system CPU load, and system CPU combined usages. You will only see this tab if you are using Chorus on your own servers. |
4. Choose one of five timescales in which you wish to view the data in the graphs.

You are here:
| Page Tree | ||
|---|---|---|
|
